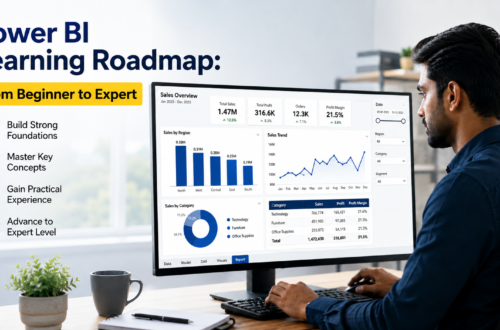

Imagine you work in a company where the sales team shares Excel files every month, the finance team prepares separate reports, and managers spend hours trying to understand which products are performing well. The information is already available, but bringing it together and finding useful answers takes time. Power BI helps turn data from different sources into reports that make business performance easier to understand.
If you are exploring Power BI career options after a course, you may have questions about the roles you can apply for, the skills employers expect, and the salary you could earn as a fresher or an experienced professional. This Power BI career guide for 2026 explains common job roles, Power BI jobs for freshers, essential skills, salary expectations, practical projects, and the PL-300 certification. It also covers what to consider when choosing a course to support your career goals.
Table of Contents
What Is Power BI?
Power BI is a business intelligence and data visualisation tool from Microsoft. It helps organisations bring information together, analyse business performance, and present findings through interactive reports and dashboards.
For example, a sales manager can use Power BI to compare revenue across regions, identify products that contribute most to sales, and review performance against targets. A finance team can analyse expenses and profitability, while an HR team can monitor employee headcount and attrition.
Power BI is used in reporting and data analysis because it helps people understand information without manually reviewing multiple spreadsheets every time they need an update. For someone interested in a data-related role, learning Power BI can be a way to develop practical reporting and analytical skills.
Who Should Learn Power BI?
You do not need to be a programmer to begin learning Power BI. Students, freshers, working professionals, and people who regularly prepare reports can all benefit from understanding how to analyse and present data.
The skills you already have can also help you decide how to apply Power BI in your field. Power BI for Excel users is a useful next step if you already work with spreadsheets, formulas, or monthly MIS reports. You can build on that experience to create more interactive reports and reduce repeated manual work.
Similarly, Power BI for finance professionals can support expense analysis, budget comparisons, and profitability reporting. Sales professionals may use it to track revenue and targets, while HR teams can analyse workforce data. People working in operations can use reports to monitor inventory, delivery performance, or other business measures.
Power BI Skills Required for Career Opportunities
Employers look for different combinations of technical and business skills depending on the role. A reporting-focused position may emphasise accurate reports and regular updates, while a Power BI Developer role may require more advanced data modelling and DAX knowledge. Understanding the following skills required for Power BI jobs can help you identify what to learn and where to focus your practice.
1. Power BI Desktop and Power BI Service
Power BI Desktop is used to develop reports, while Power BI Service supports publishing, sharing, access management, and online report use. Understanding both is useful because many reporting tasks involve more than creating charts on a computer.
For example, a reporting analyst may need to prepare a monthly sales report and make it available to the appropriate team. Knowing how reports are developed and shared helps you understand the full reporting process.
2. Power Query and Data Preparation
Business data often needs to be cleaned and organised before it can be analysed. Power Query helps prepare information from sources such as Excel files and databases by handling issues such as inconsistent formats, blank values, and duplicated records.
This skill is particularly useful when a role involves recurring reports. If a team receives updated files every month, a repeatable data preparation process can reduce manual work and make reporting more consistent.
3. Data Modelling
Data modelling in Power BI involves organising tables and establishing relationships so that information can be analysed correctly. This matters when a report combines sales, product, customer, or calendar data.
A sound model helps reports return consistent results when users filter information by different categories or time periods. It is especially important for roles involving complex reports and larger datasets.
4. DAX and Business Calculations
DAX is the formula language used to create calculations in Power BI. It supports measures such as total revenue, average order value, profit margin, and comparisons between reporting periods.
For beginners, understanding basic DAX functions and how report filters affect calculations is a useful starting point. More advanced reporting work may require deeper knowledge of DAX, including time-based calculations and complex filter conditions.
5. Report Design and Data Visualisation
Technical accuracy is important, but people must also be able to understand the information in a report. Power BI report design involves choosing appropriate visuals, presenting key figures clearly, and organising information around the questions users need to answer.
For example, a manager may need to compare regional performance quickly rather than examine a long table of transactions. Clear charts, useful filters, and meaningful labels can make that analysis easier.
6. Excel, SQL, and Communication
Excel remains useful for checking figures, reviewing source data, and performing spreadsheet-based analysis. SQL can be valuable when working with relational databases, although the requirement depends on the role and the organisation’s data systems.
Communication is equally important. Employers may expect you to explain what a report shows, clarify how a figure was calculated, and discuss findings with people who do not work directly with data. The ability to connect numbers with business questions can make your technical work more useful.
Power BI Projects for Beginners
Learning individual features is a starting point, but practical projects help you demonstrate how you apply those skills to a business problem. A well-planned project can show that you understand the purpose of a report, can work with the available data, and can present results in a way that others can follow.
If you are looking for Power BI dashboard project ideas, consider projects such as:
- Sales dashboard: Compare revenue, profit, product performance, and regional sales.
- HR analytics dashboard: Review headcount, employee attrition, and workforce trends.
- Finance dashboard: Compare actual spending with budgets and examine profitability.
- Inventory dashboard: Track stock levels, product movement, and items that may need attention.
- Marketing dashboard: Compare campaign performance, leads, and conversion measures when the required data is available.
Start with a dataset you understand and identify the questions your report should answer. Explain what the data contains, which measures you created, and what the results show. Check important totals against the original source before presenting the report.
A Power BI course with certificate can help you build practical reporting skills through guided dashboard projects covering sales, HR, and finance data. These projects give you an opportunity to apply Power BI concepts to different business reporting tasks.
Power BI vs Excel for Reporting
Excel and Power BI both support data analysis, but they are suited to different reporting needs. Excel is useful for spreadsheet calculations, quick checks, and detailed manual analysis. Power BI is particularly useful when information from different sources needs to be combined into interactive reports that can be shared with others.
Task | Excel | Power BI |
Quick calculations | Suitable for spreadsheet-based calculations | Useful when calculations are part of a wider report |
Combining recurring files | May involve repeated manual work, depending on the setup | Can combine files and repeat supported transformations during refresh |
Interactive reporting | Supports charts, tables, and spreadsheet interactions | Supports interactive reports with filters and cross-visual interactions |
Monthly reporting | May require manual updates, depending on the workbook | Can refresh data when the source and configuration allow it |
Sharing with a team | Workbooks can be shared. | Reports can be published with appropriate access permissions. |
When comparing Power BI vs Excel for reporting, consider how frequently the work needs to be repeated and how people use the results. If you need to check a few figures or perform a one-time calculation, Excel may be enough. If you regularly combine data, update reports, and share performance information with a team, Power BI may be more suitable.The two tools can also work together. Excel can remain part of the data preparation and checking process, while Power BI can present the results in a report. Learning Power BI does not mean you need to stop using Excel.
Power BI Career Options After a Course
After learning Power BI, you can explore opportunities in reporting, data analysis, and business intelligence. The right role depends on your previous experience, the skills you develop, and the responsibilities an employer expects.
Here are some common career options after learning Power BI:
Role | Typical responsibilities |
Power BI Developer | Develops and maintains reports, data models, and DAX calculations |
Data Analyst | Examines data, identifies patterns, and explains findings |
Business Intelligence Analyst | Develops reporting solutions and analyses business performance |
Business Analyst | Understands business requirements and helps teams make informed decisions |
Reporting Analyst | Prepares regular reports for departments such as sales, finance, or HR |
MIS Executive | Maintains management information reports and recurring data updates |
Data Visualisation Specialist | Presents information through clear and useful visual reports |
BI Consultant | Helps organisations plan, develop, and improve reporting solutions |
Power BI Developer vs Data Analyst
The difference between a Power BI Developer vs Data Analyst usually comes down to the work involved, although responsibilities can overlap.
A Power BI developer generally focuses on building and maintaining reporting solutions. This may include creating data models, writing DAX measures, improving report performance, and managing updates.
A data analyst spends more time investigating data, identifying patterns, checking trends, and explaining what the findings mean for the business. Power BI may be one of several tools used in this work, alongside Excel, SQL, or other analytical tools.
A business intelligence analyst may combine both areas by developing reporting solutions and helping teams understand business performance. Before applying, review the job description rather than relying only on the job title, as requirements differ between employers.
Power BI Jobs for Freshers in India
If you are searching for Power BI jobs for freshers, do not limit your search to positions titled Power BI Developer. Depending on the employer, entry-level opportunities may be listed as MIS Executive, Reporting Analyst, Junior Data Analyst, BI Trainee, or similar roles.
Searching for Power BI fresher jobs and entry-level Power BI jobs can help you find positions with different responsibilities. Read each job description carefully to understand the required tools, experience level, and type of work.
For entry-level reporting and analytical roles, employers may look for a combination of the following:
Skill | Why it matters |
Power BI Desktop | Helps you create reports and dashboards |
Power Query | Helps prepare and combine data |
DAX | Supports business calculations and comparisons |
Data modelling | Helps organise tables and relationships |
Excel | Supports data checks and spreadsheet analysis |
SQL | Helps retrieve data from databases when required |
Communication | Helps explain results and reporting findings |
How to Prepare for Entry-Level Applications
Build two or three projects using sample datasets. Choose examples that reflect the work you want to do, such as sales reporting, finance analysis, or HR dashboards.
For each project, be ready to explain the business question, how you prepared the data, which measures you used, and what the report revealed. You should also be able to explain how you checked the figures and why you selected particular visuals.
A course certificate can document your learning, but practical work gives you an opportunity to demonstrate what you can do. If a job requires SQL, Excel, or a specific type of business knowledge, identify those gaps and practise them alongside Power BI.
Power BI Salary in India
Power BI salary in India varies according to experience, location, industry, employer, and the responsibilities of the position. The following figures are indicative annual salary ranges for Power BI-related roles, not guaranteed offers or fixed market rates.
0–2 years Experience – ₹3–6 lakh
3–5 years Experience – ₹6–12 lakh
6–8 years Experience – ₹12–20 lakh
These ranges provide a broad reference. Actual salaries can be higher depending on the company, location, technical requirements, and the role itself. A reporting-focused position may have different expectations from a role involving complex data models, advanced DAX, database work, or broader analytics responsibilities.
What Can Influence Your Salary?
Several factors can affect how much an employer offers:
Practical experience: Projects and workplace experience can help demonstrate your ability to solve reporting problems.
Technical skills: Power Query, DAX, data modelling, and SQL may be relevant depending on the position.
Business knowledge: Familiarity with finance, sales, operations, or another business area can help you understand the meaning of the data.
Role responsibilities: Developing and maintaining reporting solutions may involve different requirements from preparing regular reports.
Location and employer: Salary ranges can vary between cities, industries, and organisations.
When evaluating an opportunity, compare the complete job description, responsibilities, and compensation rather than judging a role by salary alone.
About PL-300 Certification
PL-300 certification exam is Microsoft’s exam for the Power BI Data Analyst Associate certification. It assesses knowledge of preparing data, modelling data, visualising and analysing information, and managing and securing Power BI.
The certification may be useful if you want to demonstrate your knowledge of Power BI, particularly when it is mentioned in the requirements for a position you are considering. However, it does not replace practical experience. You should also be able to explain your reports, calculations, data models, and the decisions they support.
How to Choose a Power BI Course for Your Goals
When deciding how to choose a Power BI course, begin with the skills you want to develop and the type of work you want to do. A course should give you a clear understanding of the topics it covers, the practical work involved, and the support available during learning.
Review these points before enrolling:
- Syllabus: Check whether the course covers Power Query, data modelling, DAX, report design, and Power BI Service.
- Practical projects: Ask whether you will build reports yourself and practise with different datasets.
- Teaching format: Confirm whether the course is classroom-based, live online, recorded, or offered through a combination of formats.
- Learning support: Check how you can ask questions, get feedback, and revisit lessons.
- Duration and fees: Understand the course schedule, total fee, and any additional costs.
- Certificate details: Confirm which certificate the training provider issues.
- Placement assistance: If advertised, ask what it includes, such as CV guidance, interview practice, or employer referrals.
Free vs Paid Power BI Courses
When comparing free vs paid Power BI courses, consider how you prefer to learn and how much guidance you need. Free learning resources, including Microsoft Learn, can help you understand Power BI fundamentals and practise independently. They are useful if you want to explore the software before paying for structured training.
The challenge with self-study is that you must plan your learning, find answers when you encounter errors, and decide which topic to study next. A paid course may provide a structured syllabus, trainer-led sessions, practical exercises, and opportunities to ask questions. The actual level of support varies by provider, so review what is included before enrolling.
You do not necessarily need to pay to begin learning Power BI. Start with introductory resources and sample datasets, then identify the areas where you need more guidance. If you decide to take a course, compare its practical content and support rather than choosing based on price alone.
Common Mistakes to Avoid When Preparing for Power BI Roles
One common mistake is focusing only on creating attractive dashboards. A report may look polished but still contain incorrect totals or misleading comparisons. Employers may ask how you prepared the data, checked the calculations, and confirmed that the results were accurate.
Another mistake is learning features without understanding the business question they are meant to answer. For example, knowing how to create a chart is useful, but you should also understand why that chart is appropriate and what someone can learn from it.
Some beginners also add too many visuals to a report or struggle to explain their own calculations. Keep reports focused, practise explaining your decisions, and make sure you can describe the purpose of each measure and visual.
Finally, avoid assuming that completing a course or certification guarantees a job. Your skills, practical experience, communication, and the employer’s requirements all influence hiring decisions. Use projects to identify what you can already do and what you still need to practise.
Frequently Asked Questions About Power BI Careers
Is Power BI suitable for beginners?
Yes. You can begin with basic data import, simple reports, and data preparation without a programming background. As you gain experience, you can develop your knowledge of data modelling, DAX, and more advanced reporting. Practising with sample datasets can help you understand how the skills work together.
Can I learn Power BI without coding?
Many Power BI tasks, including importing data, cleaning it through Power Query, and creating visuals, can be completed without traditional programming. DAX is used for calculations, while SQL may be needed for some database-related roles. The technical requirements depend on the work you want to do.
How long does it take to learn Power BI?
The time required depends on your starting point, the amount of practice you complete, and the complexity of the reports you want to build. Basic reports may take less time to learn than advanced modelling and DAX. Working on complete projects helps you identify where you need more practice.
What skills are required for Power BI jobs?
Common requirements include Power BI Desktop, Power Query, DAX, data modelling, and report design. Some roles also require Excel, SQL, business knowledge, and communication skills. Check job descriptions for your target position because the required combination varies between employers.
Can a Power BI course help me prepare for data analyst roles?
A course can help you develop reporting and data visualisation skills. Depending on the role, you may also need SQL, Excel, analytical thinking, and knowledge of the business area you are working in. Projects can help you practise these skills and explain how you use data to answer questions.
Is the PL-300 certification worth pursuing?
It may be useful if the certification matches the requirements of the roles you are targeting or you want to demonstrate your Power BI knowledge. Its value depends on the employer and position. Review current job listings and Microsoft’s exam requirements before deciding whether to pursue it.
Does completing a Power BI course guarantee a job?
No. Completing a course does not guarantee employment. Your practical skills, project work, previous experience, interview performance, and the employer’s requirements all influence your prospects. A course can support your learning, but you must still demonstrate what you can do.
What should I include in a Power BI portfolio?
Include projects that demonstrate how you work with data and solve reporting problems. For each project, explain the purpose, the source data, the calculations and visuals used, and the findings. Check that the numbers are accurate and be prepared to discuss your decisions.
Final Thoughts
Power BI can help you develop reporting and data analysis skills that are useful across different business functions. The Power BI career options available to you will depend on your experience, the skills you build, and the responsibilities you want to take on.
Start by learning the fundamentals, then practise with projects that reflect the type of work you want to do. Build reports that answer clear business questions, check the accuracy of your results, and learn to explain your findings. If you are applying for jobs, compare the requirements of your target roles and work on any missing skills.
If you are considering formal training, review the syllabus, projects, teaching format, fees, and available support before enrolling. You can also explore the PL-300 certification if it is relevant to the positions you are targeting.
If you are exploring your next learning step, you can also browse IT courses in Lucknow to find training options that match your interests and career goals.