Power BI Course in Lucknow
Learn Power BI from scratch with Inspizone India in Aliganj, Lucknow. This 15-day bootcamp covers data analysis, Power Query, DAX and interactive dashboards, with a practical Sales Performance and Profitability Dashboard project. Suitable for beginners, with online and classroom training options.
- Course Duration: 15 days
- Mode – Live Online
- Call
What Is the Power BI Bootcamp?
The Power BI Bootcamp by Inspizone India is a structured, 15-day training programme for learners who want to understand business intelligence, analyse data and create interactive reports. It works as a starting point for anyone looking for a Power BI course for beginners or a basic Power BI course before progressing to more advanced reporting skills.
The curriculum covers Power BI fundamentals, data import, Power Query, data modelling, DAX calculations, data visualisation, report design and Power BI Service. You will learn how to turn raw business data into useful insights for tracking performance, identifying trends and supporting business decisions.
This practical Power BI training programme follows a step-by-step learning approach. You will practise importing datasets, cleaning and transforming data, creating relationships, writing DAX measures and developing interactive reports. On Day 15, you will apply these skills in a final Sales Performance and Profitability Dashboard project.

Power BI Course Detailed
| Feature | Details |
|---|---|
| Course Name | Power BI Course in Lucknow |
| Duration | 15 Days |
| Timing | 2 Hours Approx. |
| Days | Monday to Saturday |
| Language | Hindi + English |
| Students in One Batch | Maximum 10 |
| Mode | Online |
| Certificate | Yes |
| Assessments/Quizzes | Yes |
| Doubt Session | Yes |
| Prerequisites | None – No Coding or Technical Knowledge Required |
| Level | Beginner to Advanced |
Who Is This Power BI Course For?
This Power BI course for beginners is designed for learners who want to develop practical data analysis and reporting skills. It starts with the basics and gradually covers data preparation, calculations and dashboard development using Power BI Desktop. You can practise without needing paid tools.
🎓 Students & Freshers
Build practical data analysis skills for your resume and portfolio. Ideal for B.Tech, BCA, MCA and other graduates who want to learn Power BI.
💼 Working Professionals
Improve your reporting skills by analysing business data, creating interactive dashboards and tracking key performance indicators (KPIs).
📊 Excel Users
Move beyond spreadsheets and learn to turn Excel data into interactive Power BI reports and dashboards.
📈 MIS & Reporting Executives
Learn to prepare business reports, analyse trends and present data through clear visualisations and dashboards.
🤝 Freelancers & Consultants
Develop Power BI dashboard-building skills to support clients with data analysis, reporting and business insights.
🎯 Career Switchers
Explore data analytics by learning Power BI fundamentals, data preparation, DAX measures and dashboard development through practical training.
🚀 Complete Beginners
Start learning Power BI from scratch with step-by-step guidance on importing data, cleaning datasets, creating reports and building dashboards. No prior Power BI experience is required.
Power BI Course Project
Create an interactive Power BI dashboard to analyse sales, profit, orders, regional performance, and product trends using KPIs, charts, and filters.
15-Day Power BI Course Curriculum
- Introduction to Business
- Intelligence and Power BI
- Power BI Desktop interface and workflow
- Report, Data and Model views
- Reports vs dashboards and semantic models
Overview of the data-to-report process
Import Excel and CSV files
Understand rows, columns and data types
Identify date, text and numeric fields
Understand data quality and source structures
Load data into Power BI
Remove duplicates, blank rows and errors
Handle missing and incorrect values
Change data types and clean text fields
Rename columns and remove unnecessary fields
Understand applied steps and data profiling
Filter and sort data
Split and merge columns
Create conditional columns
Merge and append queries
Group By and Pivot/Unpivot
Apply changes and understand data refresh
Understand tables, keys and relationships
Primary keys and foreign keys
One-to-many and other relationship cardinalities
Fact and dimension tables
Introduction to star schema
Active relationships and filter direction basics
Introduction to Data Analysis Expressions (DAX)
Measures vs calculated columns
Row context and basic calculation concepts
SUM, COUNT, DISTINCTCOUNT and AVERAGE
IF and DIVIDE
Create and format basic measures
Understand CALCULATE and filter context
Introduction to FILTER
Calculate total sales, orders and profit
Calculate profit margin and percentages
Ranking and Top N analysis
Validate measures against source data
Create and understand a date table
Mark a date table where appropriate
Analyse monthly and yearly trends
Introduction to month-on-month comparisons
Introduction to time-intelligence functions
Understand running totals and cumulative calculations
Cards, KPI visuals, bar and column charts
Line charts for trends
Tables and matrices
Pie and donut charts where appropriate
Select visuals based on business questions
Format labels, titles, legends and numbers
Report layout and visual hierarchy
Alignment, spacing and consistent formatting
Colours, themes and chart placement
Organise KPIs and charts for readability
Avoid clutter and misleading visualisations
Design clear report pages for different users
Visual-, page- and report-level filters
Slicers and sorting
Cross-filtering and Edit Interactions
Drill-down and drill-through
Filter behaviour across visuals
Test report interactions
Bookmarks and navigation buttons
Report page navigation
Tooltips and custom tooltip pages
Conditional formatting
Dynamic titles and KPI displays
Improve report usability and navigation
Identify sales trends and performance gaps
Compare products, categories and regions
Analyse profitability and top performers
Interpret KPIs and changes over time
Write concise business findings
Understand executive summary design
Refresh imported data and understand refresh behaviour
Check calculations, relationships and filters
Troubleshoot common report issues
Review report performance and usability
Introduction to Power BI Service and workspaces
Publishing, sharing permissions and licence limitations
Review the complete data-to-report workflow
Create a Sales Performance and Profitability Dashboard in Power BI to analyse sales, profit, orders, regional performance and product trends using interactive charts, KPIs and filters.
Why Learn Power BI Skills?
- In-demand career skills: Develop practical data analysis skills to help organisations make informed business decisions.
- Strong analytical capabilities: Learn to prepare, model, analyse, and visualise data to uncover meaningful business insights.
- Professional dashboard development: Build interactive Power BI reports and dashboards to track KPIs, sales, profits, and business performance.
- Skills across industries: Apply Power BI in finance, sales, marketing, operations, and business analytics.
- Career opportunities: Develop skills relevant to roles such as Data Analyst, BI Analyst, Business Analyst, Reporting Analyst, and Power BI Developer, depending on your experience and technical knowledge.
Power BI Training Features
- Live Classes — Learn from anywhere with flexible online training.
- Study Material — Get helpful resources for self-study and revision.
- Recorded Classes — Access recorded sessions for easy revision anytime.
- Small batches – Small batches of up to 10 students for personal attention and project feedback.
- One Complete Projects — Gain hands-on experience through relevant projects.
- Course Certification — Receive a certificate after completing the course.
Power BI vs Tableau - Quick Comparison
| Feature | Power BI | Tableau |
|---|---|---|
| Ease of Learning | Beginner-friendly, especially for Excel users | Advanced analysis requires practice |
| Data Visualisation | Interactive reports and business dashboards | Advanced visual exploration |
| Data Preparation | Power Query built in | Tableau Prep available separately |
| Microsoft Integration | Strong integration with Excel and Microsoft 365 | Supports Microsoft and other platforms |
| Cost | Free Desktop version available | Paid plans; free Tableau Public has limitations |
| Best For | Business reporting, KPI tracking and data analytics | Advanced visual analysis and data exploration |
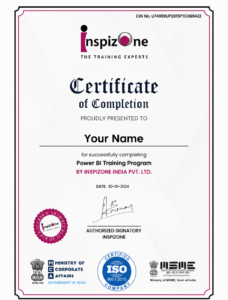
Get Certified in Power BI & Stand Out
Upon successful completion of the Power BI course, receive a certificate from Inspizone Pvt. Ltd. to showcase your data analysis, reporting, and dashboard development skills.
- Certificate from Inspizone Pvt. Ltd. upon successful course completion
- Demonstrate your Power BI training and practical learning
- Strengthen your resume and LinkedIn profile
About Inspizone India Pvt. Ltd.
Inspizone India is an IT training institute in Lucknow offering technical training programmes for students and working professionals. Its training areas include web development, programming, digital marketing, workflow automation and data analytics. The Power BI training programme combines structured lessons with practical exercises and a final dashboard project. Whether you are starting with a basic Power BI course or developing your existing reporting skills, the curriculum provides a guided introduction to data analysis and business intelligence.
Start Your Power BI Learning Journey in Lucknow
Learn Power BI in 15 days with hands-on training and a practical final project. Join a small batch of up to 10 students.
Contact us for the next batch date and course details.
Frequently Asked Questions (FAQ)
Is this Power BI Bootcamp suitable for beginners?
Yes. The Power BI Bootcamp starts with fundamentals and progresses to data import, Power Query, data modelling, DAX, visualisation and dashboard development. No prior Power BI experience is specified as a requirement in the course outline.
What is covered in Basic Power BI Courses?
Basic Power BI Courses typically introduce data import, cleaning, data types, basic modelling, DAX measures and report visualisation. This 15-day programme covers these foundations and also introduces interactive reporting, business analysis and Power BI Service.
Can I learn Power BI in 15 days?
This 15-day programme is designed to help you build a foundation in Power BI through structured lessons and practical exercises. You will work towards a Sales Performance and Profitability Dashboard. Developing advanced skills and professional experience will require further practice.
Is Online Power BI Course Training with Certification available?
Please contact Inspizone India to confirm whether online training is available for the current batch and what certificate is provided after successful completion. The training mode and certification details should be verified before enrolment.
What project will I build during the Power BI course?
You will build a Sales Performance and Profitability Dashboard using a free sales dataset. It includes sales, profit, orders and profit margin KPIs, monthly sales trends, regional comparisons, product/category analysis, interactive filters and a final presentation of business findings.
Is the Power BI course practical or theoretical?
The course includes practical application throughout the curriculum. You will work with datasets, clean and transform data, create relationships, build DAX measures, design visualisations and test report interactions. The final project requires you to build and present a complete Sales Performance and Profitability Dashboard.
Is the Power BI course taught online or in a classroom?
The Power BI course is delivered through live online classes and offline classes in Lucknow. Recorded sessions are also provided for revision and future reference.
Do I need to know coding before joining the Power BI course?
The curriculum begins with Power BI fundamentals and does not specify programming as a prerequisite. Basic computer knowledge is recommended. The course focuses on Power Query, data modelling, DAX and visual report development rather than general-purpose programming.
Can I learn or use Power BI on a Mac?
Power BI Desktop is not natively available for macOS. However, Mac users can accessPower BI Service through a web browser or use Power BI Desktop through a Windows virtual machine. The appropriate setup can be explained before you begin the practical training.
How can I enrol in the Power BI course or request more information?
You can contact Inspizone India to enquire about Power BI course enrolment, fees, schedule, and other details. The team can guide you through the registration process.

See how Inspizone India Studio’s courses help our students grow and succeed
Inspizone India’s summer training in Lucknow was amazing! The trainers explained everything clearly and the practical sessions helped me gain real skills in IoT and robotics.
The summer training at Inspizone was very well-structured. I learned Python programming and data analytics from scratch, and the trainers were super helpful throughout.
Inspizone India provides a perfect learning environment for students in Lucknow. The projects were practical, and I now feel confident applying the skills I learned in real-world scenarios.
The trainers at Inspizone India are highly skilled and approachable. They make difficult concepts easy and encourage students to work on innovative projects.
Inspizone India offers both online and offline summer training in Lucknow. I loved the flexibility and the hands-on learning approach – truly the best training experience!
Blogs and News